Gold Miners: US-Listed Western Majors vs China Majors
Newmont · Agnico · Kinross vs Zijin · Shandong Gold · Zhaojin
September 3, 2026 — Cross-Market Sector Comparison (gold ~$4,474/oz)
The user’s thesis (to test): US companies don’t have as low a cost as Chinese ones, but they carry less non-lucrative business and focus on mining gold.
TL;DR — your instinct is half right, and the other half is almost inverted. Here’s the data-grounded picture:
- Cost: partly true, but “China = lowest cost” is FALSE. Chinese majors (Shandong ~$1,250, Zijin ~$1,480 AISC) are cheaper than Newmont ($1,609) / Barrick ($1,637) — but the single lowest-cost major is Western: Agnico Eagle at $1,339 — below every Chinese name except Shandong. So it’s “Newmont/Barrick are high-cost,” not “the West is high-cost.”
- Pure-play: INVERTED for the flagship you named. Zijin is a COPPER-gold major — gold is only ~33% of revenue; copper (~50-55%) is its main profit engine, not “non-lucrative.” Meanwhile Newmont is the >85%-gold pure-play. For Zijin-vs-Newmont your framing is backwards: Zijin deliberately diversified into high-return copper. The Chinese pure-play is Shandong Gold (~95% gold).
- Where “non-lucrative business” DOES fit: state-owned smelting/refining arms (China Gold / parts of Zhaojin) that add low-margin toll volume — a real China-SOE drag, but not Zijin’s copper.
- Valuation: China screens cheaper AND higher-yield AND higher-growth AND higher-ROE — but for reasons. Zijin fwd P/E ~9.3, div ~3.0%, ROE ~36% vs Newmont fwd P/E ~13, div ~0.8%, ROE ~26%. The gap is the China/SOE-governance + geopolitical + RMB/capital-control discount.
- The real trade-off isn’t “cost vs focus” — it’s: pure gold-price optionality (Western pure-plays) vs a cheaper, copper-levered, higher-growth but China-discounted compounder (Zijin).
- Education/analysis, NOT investment advice.
⚠️ Protocol & data notice
Applies the Two-Step Research Protocol and the repo’s Cyclical CRules (gold/copper are commodity-price-driven → CRule 1/2/4/6 active). §1 fact-base/Rule-4 · §2 Step-1 draft · §3 Step-2 review · §4 cost curve · §5 business mix (the thesis correction) · §6 operating leverage · §7 valuation · §8 Day1Global C/L/O + verdict. Model reproducible via run_gold_compare.py. Gold spot ~$4,474/oz (Kitco, Sep 3 2026).
Section 1 — Fact-base (2025 actuals / FY-guidance; Rule-4 ranges flagged)
“US market” clarification (Rule 4): only Newmont is US-domiciled. Agnico, Kinross, Barrick are Canada-HQ but US-listed (NYSE) with heavy US operations — I group them as “US-listed Western majors,” the pool the user means by “US names.” Zijin/Shandong/Zhaojin are HK/A-share listed.
| Company | Mkt | 2025 gold (Moz) | AISC ($/oz) | Gold % of rev | Mcap (~$B) | Fwd P/E | Div | Character |
|---|---|---|---|---|---|---|---|---|
| Newmont | US | 5.9 | 1,609 | ~88% | 137 | 12.9 | 0.8% | World #1; gold pure-play post-Newcrest |
| Agnico Eagle | US-listed (Can) | 3.45 | 1,339 ⬅ lowest | ~97% | 105 | 16.6 | 0.9% | Tier-1 jurisdictions; cost discipline |
| Kinross | US-listed (Can) | 2.0 | ~1,480 | ~99% | 38 | 10.3 | 0.5% | Near-pure gold; Nevada/Alaska/W.Africa |
| Barrick | US-listed (Can) | 3.26 | 1,637 | ~80% | 72 | 11.1 | 1.9% | Gold + copper ambition; jurisdiction risk |
| Zijin Mining | China | 2.9 (~90t) | ~1,480 | ~33% ⬅ | ~120 | 9.3 | 3.0% | COPPER-gold major (1.09Mt Cu); 45% overseas |
| Shandong Gold | China | 1.5 (~45t) | ~1,250 | ~95% | 24 | 11.0 | 1.2% | China’s gold pure-play; deep Jiaodong |
| Zhaojin Mining | China | ~0.6 (~18t) | ~1,300→1,100 | ~90% | 10 | 10.0 | 0.5% | Pure gold; Haiyu ramp; Zijin-affiliated |
Rule-4 flags: (a) AISC definitions differ China↔West (Chinese “克金成本”/cash cost often quoted below Western AISC — I use best-effort AISC-equivalent, ±$100-150); (b) Zijin’s gold-oz counts attributable vs total differ by source (~2.9-3.0 Moz); (c) mcaps are cross-currency (HKD/CNY→USD approximations); (d) Kinross AISC is the industry-median proxy (~$1,480), not a clean disclosure.
Section 2 — Step 1: Concise Research Draft
Core conclusion: The US-vs-China gold divide is not “high-cost/focused vs low-cost/unfocused.” It is “pure gold-price optionality at a premium (Western pure-plays) vs a cheaper, copper-levered, faster-growing compounder carrying a China discount (Zijin).” The user’s cost claim holds only for Newmont/Barrick; the “focus” claim is inverted for Zijin.
Supporting (claim → evidence):
- Chinese majors are lower-cost than Newmont/Barrick — but not the global floor → Shandong $1,250 / Zijin $1,480 vs Newmont $1,609; yet Agnico $1,339. Evidence: §1/§4 — obtained.
- Zijin is copper-first, not a gold pure-play → gold ~33% of revenue, copper ~50-55%. Evidence: §1/§5 — obtained.
- China screens cheaper + higher yield + higher ROE → Zijin fwd P/E 9.3, div 3.0%, ROE 36%. Evidence: §7 — obtained (yfinance + filings).
Opposing (claim → evidence):
- The China discount may be justified, not an opportunity → SOE governance, RMB/capital controls, geopolitical/listing risk, disclosure gaps. Evidence: qualitative; hard to quantify — partly unknown.
- AISC is not apples-to-apples → Chinese cost accounting (byproduct credits, tax, royalty, reclamation) differs from Western AISC → the “China is cheaper” gap may narrow on a like-for-like basis. Evidence: standardized cost bridge — not fully obtained.
Section 3 — Step 2: Strict Peer Review (draft NOT rewritten)
- Facts that need verification: standardized AISC on one definition (Chinese cash-cost vs World Gold Council AISC — the single biggest data risk); Zijin’s exact segment revenue/gross-profit split (copper vs gold vs zinc/lithium); Kinross’s disclosed AISC; whether “gold % of revenue” should be % of gross profit (copper’s margin ≠ gold’s, so revenue-share understates copper’s profit dominance at Zijin).
- Logical leaps / equivocation: the central equivocation is “diversification = non-lucrative” — Zijin’s copper is more lucrative per dollar invested than much of its gold, so “focus on gold = better” is a value judgment, not a fact. Also “US” vs “Western” (only Newmont is US); and AISC rank = quality rank (ignores grade depletion, reserve life, jurisdiction risk).
- Missing counterexamples / competing explanations: Agnico (Western, lowest cost) breaks the “West = high cost” story; Barrick is also pivoting to copper (so “copper diversification” is not a uniquely-Chinese trait); the gold-price super-spike ($4,474) makes all AISC differences second-order to volume × price right now (a $270/oz AISC gap is ~6% of a ~$3,000/oz margin).
- Most important primary sources to add: company 10-K/annual reports & AISC reconciliations (Newmont, Agnico, Kinross, Barrick); Zijin/Shandong/Zhaojin annual reports (segment tables, reserves, overseas mix); World Gold Council AISC methodology; reserve/resource statements (P&P oz, mine life).
- Speculation, not fact: “China discount is the reason for the cheap multiple” (plausible attribution, not proven); any implied ranking of who’s the better buy; the durability of Zijin’s copper margins; that Western pure-plays give “better gold optionality” (a characterization).
Section 4 — The cost curve (testing “US higher cost than China”)
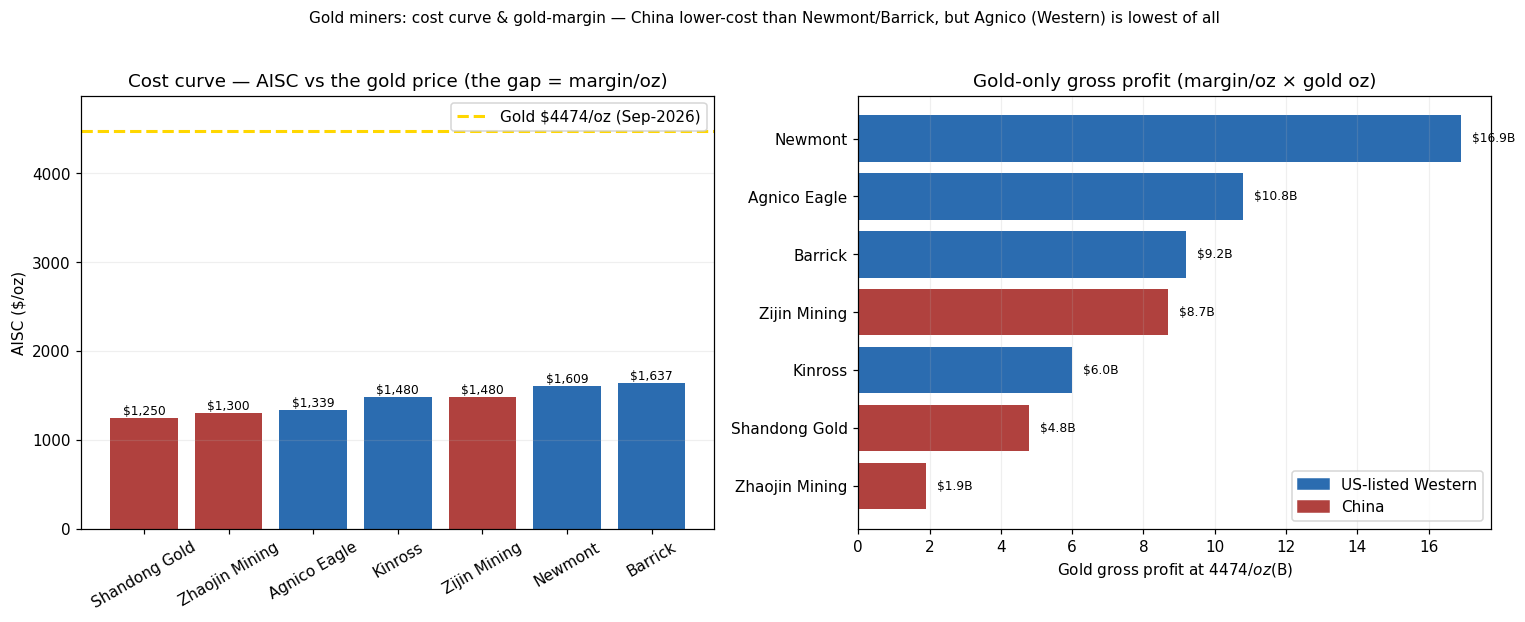
AISC ranking (low → high), 2025:
| Rank | Company | Market | AISC | Gold % rev |
|---|---|---|---|---|
| 1 | Shandong Gold | China | $1,250 | ~95% |
| 2 | Zhaojin | China | ~$1,300 | ~90% |
| 3 | Agnico Eagle | Western | $1,339 | ~97% |
| 4 | Kinross | Western | ~$1,480 | ~99% |
| 4 | Zijin | China | ~$1,480 | ~33% |
| 6 | Newmont | Western | $1,609 | ~88% |
| 7 | Barrick | Western | $1,637 | ~80% |
Verdict on the cost claim: partly true. Chinese miners do undercut Newmont & Barrick — driven by lower labor, integrated domestic smelting, and lower royalty/tax burdens. But the West’s Agnico is the 3rd-lowest of all and beats Zijin/Kinross — so the accurate statement is “Newmont and Barrick are the high-cost majors,” not “the West is high-cost.” (Rule-4: on a fully-standardized AISC the Chinese edge may compress — Chinese quotes sometimes exclude items Western AISC includes.)
Section 5 — Business mix: the thesis correction (focus vs diversification)
This is where the data most sharply reframes the question.
Gold as % of revenue (higher = more “pure gold”):
Kinross      ~99%  ██████████████████████████  (Western near-pure gold)
Agnico       ~97%  █████████████████████████
Shandong     ~95%  ████████████████████████    (China pure-play)
Zhaojin      ~90%  ███████████████████████
Newmont      ~88%  ██████████████████████       (Western pure-play, world #1)
Barrick      ~80%  ████████████████████
Zijin        ~33%  ████████                     (COPPER-gold major)
- The pure-plays are mostly WESTERN (Kinross ~99%, Agnico ~97%, Newmont ~88%). Zijin — the Chinese flagship — is the least pure, at ~33% gold. So the user’s “US = focused on gold, China = diversified” is exactly backwards for the Zijin-vs-Newmont pair.
- Crucially, Zijin’s diversification is lucrative, not “non-lucrative.” Copper (~1.09 Mt/yr, ~50-55% of revenue) is Zijin’s main profit engine and the reason its ROE (~36%) tops Newmont’s (~26%). Calling it “non-lucrative” inverts reality — copper is why Zijin compounds faster.
- Where the “non-lucrative” intuition IS valid: low-margin gold smelting/refining at the state-owned names (China Gold/中金黄金, parts of Zhaojin) — toll processing that inflates revenue but adds little profit. That’s a genuine China-SOE drag — but it’s a different company set than Zijin.
- So the honest split is: Western majors = cleaner gold-price proxies (you get pure bullion beta); Zijin = a copper-gold conglomerate (you get a cheaper, faster-growing miner but with copper-cycle and China exposure); Shandong Gold = the true like-for-like to Newmont (a Chinese gold pure-play, and lower-cost).
If you want a clean US-vs-China gold comparison, the right pair is Newmont vs Shandong Gold — not Newmont vs Zijin. Zijin-vs-Newmont is really “copper-gold conglomerate vs gold pure-play.”
Section 6 — Operating leverage (why AISC differences are second-order right now)
At gold ~$4,474/oz, every major earns a ~$2,800–3,200/oz gross margin — so the AISC spread ($1,250→$1,637 = $387) is only ~6-8% of the margin. Volume × price dominates; the cost ranking is a tie-breaker, not the driver (CRule 4/6).
Gold-only gross margin/oz by gold price (margin = price − AISC):
| Gold price | Shandong ($1,250) | Agnico ($1,339) | Zijin ($1,480) | Newmont ($1,609) | Barrick ($1,637) |
|---|---|---|---|---|---|
| $2,500 | $1,250 | $1,161 | $1,020 | $891 | $863 |
| $3,000 | $1,750 | $1,661 | $1,520 | $1,391 | $1,363 |
| $3,500 | $2,250 | $2,161 | $2,020 | $1,891 | $1,863 |
| $4,474 (now) | $3,224 | $3,135 | $2,994 | $2,865 | $2,837 |
Gold-only gross profit at $4,474/oz (margin × gold oz) — this is where scale beats cost:
- Newmont $16.9B (high cost, but 5.9 Moz) > Agnico $10.8B > Barrick $9.2B > Zijin $8.7B (gold segment only) > Kinross $6.0B > Shandong $4.8B > Zhaojin $1.9B.
Key insight (CRule 4): the lowest-cost miner (Shandong) makes less than a third of the highest-cost miner’s (Newmont) gold profit, because Newmont mines ~4× the ounces. At a $4,000+ gold price, production scale and reserve life matter far more than a $300 AISC edge. Cost only becomes decisive if gold falls back toward $2,000–2,500 (then the low-cost names’ margins hold up while high-cost names compress — the classic CRule 2 downturn).
Section 7 — Valuation (China cheaper, but for reasons)
| Metric | Newmont | Agnico | Kinross | Zijin | Shandong | Zhaojin |
|---|---|---|---|---|---|---|
| Fwd P/E | 12.9 | 16.6 | 10.3 | 9.3 | 11.0 | 10.0 |
| Div yield | 0.8% | 0.9% | 0.5% | 3.0% | 1.2% | 0.5% |
| ROE (approx) | ~26% | ~high | — | ~36% | — | — |
| Growth | flat/declining vol | steady | steady | ~17% CAGR | steady | ramping |
Read: Zijin screens as the “cheapest + highest-yield + highest-growth + highest-ROE” of the group — on paper, dominant. The catch is the discount is compensation for real risks:
- China/SOE governance & disclosure (related-party, state influence, capital allocation opacity).
- Geopolitical / listing / RMB & capital-control risk for a foreign holder.
- Copper-cycle exposure — Zijin’s earnings are not pure gold; a copper downturn hits it in a way it doesn’t hit Newmont.
- Agnico’s premium (fwd P/E 16.6) is the mirror image — the market pays up for Tier-1 jurisdictions, low cost, and clean governance. Quality is priced.
Section 8 — Day1Global (C/L/O) & verdict
Module C — Cash flow: all are gushing FCF at $4,474 gold; Zijin reinvests heavily (copper/lithium growth capex) → lower payout but higher growth; Western majors (esp. Newmont) tilt to buybacks/dividends and “harvest” posture (Newmont 2026 volume declining). Module L — Ownership: Western = dispersed institutional, board-independent. Chinese = state/founder-influenced (Zijin’s Fujian SASAC roots; Shandong Gold SOE) → related-party & policy risk (the core of the discount). Module O — Accounting quality: the AISC-definition gap is the key comparability risk; Chinese byproduct/tax treatment and reserve-reporting standards (Chinese GB vs JORC/NI 43-101) are not identical — do not compare reserves naively.
Anti-bias flag: the user’s framing risks a narrative bias (“US = focused & honest, China = cheap & unfocused”). The data says: Zijin is the unfocused one (by design, profitably); the West holds both the highest-cost major (Newmont) AND the lowest (Agnico).
Verdict — reframed for the user:
Your thesis:   US = higher cost but pure-gold focus; China = low cost but non-lucrative diversification.
Data verdict:  HALF RIGHT, HALF INVERTED.
  - Cost:   TRUE vs Newmont/Barrick; FALSE globally (Agnico $1,339 is the low-cost leader).
  - Focus:  INVERTED for Zijin — it's a COPPER major (gold ~33% rev); Newmont is the pure-play.
  - "Non-lucrative": copper is Zijin's BEST business; the tag fits SOE smelting, not Zijin.
Right pairs:   Gold pure-play showdown = Newmont vs Shandong Gold (Shandong lower-cost).
               Zijin vs Newmont = copper-gold conglomerate vs gold pure-play (different animals).
The real choice: pure bullion optionality at a premium (Western pure-plays)
               vs a cheaper, copper-levered, faster-growing, China-discounted compounder (Zijin).
At $4,474 gold: scale/reserves > a $300 AISC edge (Newmont's gold profit 2x Shandong's).
               Cost only becomes decisive if gold falls back toward $2,000-2,500 (CRule 2).
Bottom line for the user: you’re right that Newmont/Barrick are higher-cost than the Chinese majors — but the cleanest low-cost operator is actually Western (Agnico), and your “China = unfocused/non-lucrative” read is backwards for Zijin, whose copper diversification is its most profitable, fastest-growing leg. The genuine decision isn’t cost-vs-focus; it’s “do I want pure, clean gold-price beta (Western pure-plays, priced at a premium) or a cheaper, higher-growth, copper-levered miner that carries a China discount (Zijin)?” For a like-for-like gold comparison, use Newmont vs Shandong Gold. And with gold at $4,474, all of them print money — the AISC gap is a downturn hedge, not today’s differentiator.
Section 9 — If you’re long-term bullish on gold: how to choose (and a 2-name barbell)
Follow-up: “Agnico looks more elastic — low cost + pure gold — so its P/E is higher. If I’m a long-term gold bull, how do I pick among the six, and if I pick two, which?”
9.0 First, correct the premise (this flips the whole choice)
Agnico is the LEAST elastic to the gold price, not the most. Gold-profit elasticity = Price ÷ (Price − AISC) — a lower cost means a bigger margin base, so a given gold move is a smaller percentage change. Its premium P/E (16.6×) prices SAFETY/quality, not torque. The torque ranking (gold-profit % move per 1% gold move) is the opposite of “low cost”:
| Rank (gold torque) | Company | Elasticity P/(P−AISC) | Equity gold-torque (×gold% of rev) | Read |
|---|---|---|---|---|
| 1 | Barrick | 1.58× | 1.26× | Most torque, but only 80% gold + jurisdiction risk |
| 2 | Newmont | 1.56× | 1.37× | High torque + #1 scale; execution/volume-decline baggage |
| 3 | Kinross | 1.49× | 1.48× ⬅ highest | High torque AND ~99% gold → cleanest pure-gold torque |
| 3 | Zijin | 1.49× | 0.49× ⬅ lowest | Gold torque diluted — only 33% gold (rest = copper) |
| 5 | Agnico | 1.43× | 1.39× | Lowest torque of the Western pure-plays = the quality/defensive one |
| 6 | Zhaojin | 1.41× | 1.27× | Low torque + small/ramp |
| 7 | Shandong | 1.39× | 1.32× | Lowest torque = most defensive to a gold fall |
Two clean takeaways:
- Maximum gold upside torque = the high-cost pure-plays (Barrick, Newmont, Kinross) — with Kinross the best “clean” torque (high elasticity × ~99% gold, cheapest at ~10× P/E).
- Zijin gives the LEAST gold exposure per dollar (0.49× equity gold-torque) because 2/3 of it is copper. That’s not bad — but if your thesis is specifically gold, Zijin is a debasement-basket play (gold + copper), not a gold play.
Bull-case check (gold $4,474 → $6,000): gold-profit rises +47% (Shandong) to +54% (Barrick) — a narrow spread, because at $4,000+ every margin is already fat. The AISC gap matters far more on the DOWNSIDE (if gold falls to $2,000-2,500, low-cost names keep fat margins while high-cost names compress — CRule 2). So “high cost = more torque” is really “more torque up AND more pain down.”
9.1 The choice depends on what kind of gold bull you are
| If your view is… | Pick | Why |
|---|---|---|
| Aggressive (gold to $6k+, want max torque) | Kinross | Best clean gold-torque (1.48×), ~99% gold, cheap ~10× P/E, Nevada/Alaska + W.Africa |
| Steady compounder (gold grinds higher, sleep at night) | Agnico | Best-in-class ops, Tier-1 jurisdictions, lowest Western AISC — but you pay 16.6× (“quality is priced”) |
| Value + growth + reflation (gold AND copper) | Zijin | Cheapest (9.3×), 3% yield, ~17% growth, 36% ROE, copper double-levers the debasement trade — at a China discount |
| China pure gold | Shandong Gold | Low cost, ~95% gold, the true like-for-like to Newmont — but less liquid for a foreign holder |
| Avoid (for a core) | Barrick / Zhaojin | Barrick = torque with a landmine (Mali/PNG disputes); Zhaojin = too small/ramp-speculative |
Single best all-rounder for most gold bulls: Kinross (torque + value + near-pure + cleaner jurisdictions than Barrick) or Agnico (if you prioritize safety over torque and accept the premium).
9.2 If you pick TWO — the barbell (this repo’s favorite structure)
The right 2-name portfolio pairs a low-cost QUALITY anchor with a satellite that is uncorrelated on the risk axis (jurisdiction / commodity / valuation-style) — so you’re not doubling one bet (the same logic as the 30/30/40 barbell and the “two alpha domains must be uncorrelated” rule).
Option A — “Clean gold barbell”: Agnico + Kinross ✅ (best if you want pure, Western, no-copper, no-China gold)
- Agnico = the quality/defensive anchor (lowest Western AISC, Tier-1, but least torque).
- Kinross = the torque/value satellite (highest clean gold-torque, ~10× P/E).
- You get: pure gold-price beta, quality + torque combined, both liquid Western names, clean governance.
- Trade-off: no diversification of jurisdiction or commodity — it’s a concentrated bet that gold specifically rises. Perfect if that’s exactly your thesis.
Option B — “Diversified debasement barbell”: Agnico + Zijin ✅ (best risk-adjusted if you can hold China risk)
- Agnico = Western, low-cost, Tier-1, quality-premium, pure gold.
- Zijin = China, cheap, high-growth, copper-levered, deep-value.
- These are maximally uncorrelated on the risk axis: Tier-1 West ↔ China; pure gold ↔ gold+copper; quality-premium (16.6×) ↔ deep-value (9.3×). If the broad debasement trade (gold and copper rising on monetary/fiat concerns) is your real view, this captures it while diversifying governance and commodity risk.
- Trade-off: one leg carries China/SOE/geopolitical risk; and Zijin gives less pure gold torque.
My default recommendation:
- If your conviction is specifically GOLD → Option A (Agnico + Kinross): quality anchor + cleanest torque, no dilution.
- If your conviction is the broader DEBASEMENT/reflation trade → Option B (Agnico + Zijin): best diversification and the cheapest growth, accepting China risk in one leg.
- Weighting: for a long-term bull, tilt to the anchor (~60% Agnico / 40% satellite) if you want lower volatility; go ~50/50 (or overweight the satellite) if you want more torque and can stomach drawdowns.
Bottom line for the user: the intuition to correct is that low-cost/pure ≠ more elastic — Agnico is the low-torque quality name (its rich P/E is a safety premium), while the high-cost pure-plays (Kinross/Newmont/Barrick) give the most gold upside torque. For a long-term gold bull picking one, Kinross is the sharpest single (torque + value + near-pure); for a quality anchor, Agnico. Picking two, run a barbell: Agnico + Kinross for a pure gold bet, or Agnico + Zijin for the diversified debasement bet (quality West anchor + cheap copper-levered China growth). Avoid Barrick (jurisdiction landmines) and Zhaojin (too small) as a core. (All at gold $4,474 — remember the AISC gap is mostly a downside hedge, not today’s differentiator.)
Section 10 — Two requested charts: miners vs gold, and Zijin vs gold+copper
(Weekly, dividend-adjusted / 复权, rebased to 100 at 2021-01. Reproducible: run_price_charts.py.)
10.1 The six miners vs the gold price
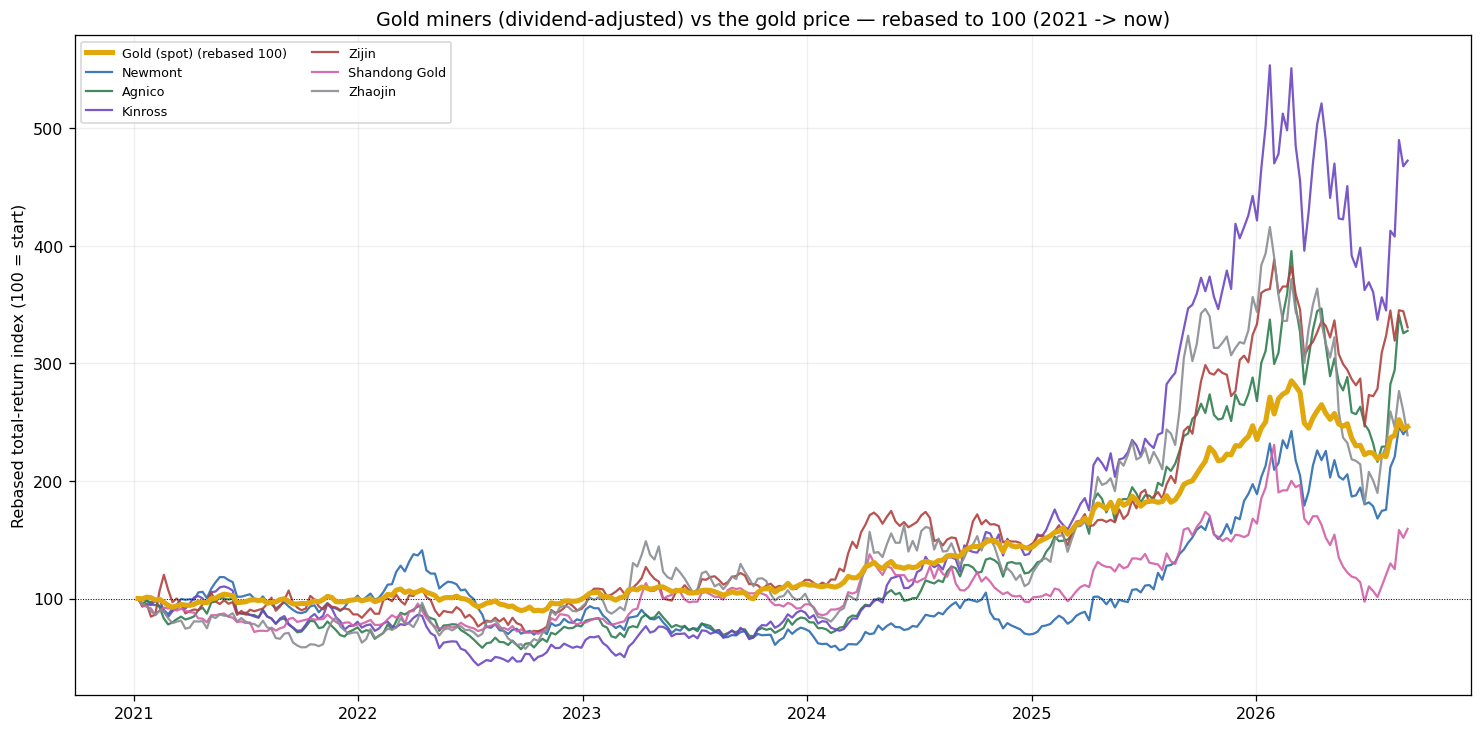
Performance since 2021 (rebased, 100 = start):
| Rebased now | Total return | Read | |
|---|---|---|---|
| Kinross | 472 | +372% | The torque winner — empirically confirms §9’s “highest clean gold-torque” |
| Zijin | 331 | +231% | Amplified — but copper-driven (see §10.2) |
| Agnico | 328 | +228% | Quality and strong return — earns its premium |
| Gold (spot) | 246 | +146% | The baseline |
| Zhaojin | 239 | +139% | ~tracked gold; small-cap ramp |
| Newmont | 245 | +145% | Only matched gold — high theoretical torque eaten by execution/volume decline |
| Shandong Gold | 159 | +59% | The laggard (A-share; grade/cost pressure) |
Two things the chart teaches:
- Operating leverage is visible and lagged. From 2021 to mid-2024 every miner traded below gold (mining cost-inflation + company issues squeezed margins). Then in 2025–26, as gold went parabolic and margins got fat, the miners exploded above gold — the classic CRule-4 non-linear payoff, but only once price ran far above cost.
- The theoretical torque ranking held — with an execution overlay. Kinross (high torque, clean) won; Newmont underperformed its high theoretical torque because volume decline + integration ate the leverage (why §9 flagged it “torque diluted by self-inflicted problems”). Reality = torque × execution.
10.2 Zijin alone: stock vs gold AND copper
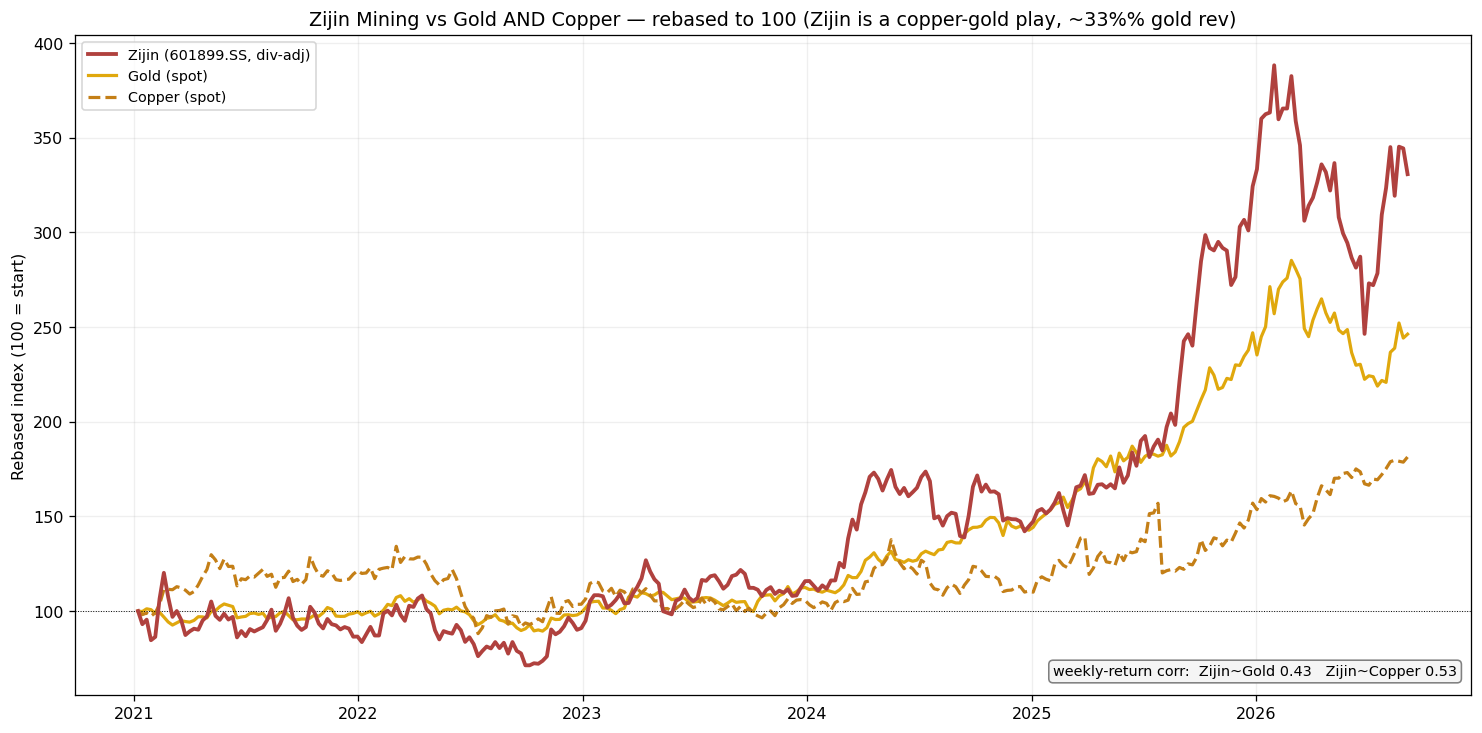
Weekly-return correlation: Zijin ↔ Copper = 0.53 > Zijin ↔ Gold = 0.43.
This is the visual proof of the whole thesis correction (§5): Zijin moves more with copper than with gold. It amplifies both, but copper is the bigger driver — because copper is ~50-55% of revenue and its main profit engine. If you buy Zijin as a “gold stock,” you are actually buying a copper-gold basket with a slight copper tilt. For a pure long-gold thesis that makes Zijin the least direct expression (§9’s 0.49× equity gold-torque); for a debasement/reflation thesis (gold and copper both rising on fiat concerns), it’s the most complete single name.
Reproduce it yourself
cd gold_miners
python run_gold_compare.py     # writes data/peers.csv, margin_by_price.csv + charts/aisc_margin.png
Assumptions (production, AISC, mix) are explicit at the top of run_gold_compare.py and editable. Data files: gold_miners/data/{peers,margin_by_price}.csv. Chart: gold_miners/charts/aisc_margin.png.
Price charts (§10): python run_price_charts.py → charts/{miners_vs_gold,zijin_gold_copper}.png + data/{miners_vs_gold,zijin_gold_copper}.csv. Uses dividend-adjusted (复权) weekly prices; gold=GC=F, copper=HG=F; the SIX = top-3 each market (Barrick’s NYSE ticker changed GOLD→B in 2025, so it’s excluded here).
Sources (accessed Sep 3, 2026): Mining Magazine “largest gold miners of 2025”; Selborne AISC benchmarks; company FY-2025 results (Newmont, Agnico, Barrick, Kinross); Sina Finance / Xueqiu / cninfo filings (Zijin, Shandong Gold, Zhaojin, China Gold); MarketScreener / Yahoo (valuation); Kitco (gold $4,474/oz); yfinance (live multiples). AISC comparability (China cash-cost vs WGC AISC) and Zijin’s segment split are the key Rule-4 uncertainties.
Two-Step Research Protocol applied (§2 draft + §3 review). Cyclical CRules 1/2/4/6 applied (commodity-price-driven). Figures are 2025 actuals/estimates; AISC definitions differ across markets. Education/analysis only — not investment advice.