Market Gauge: How High Is the S&P 500, and How Good Is the Quality?
Four axes — breadth · valuation · positioning · quality
August 4, 2026 — Market-Level Analysis
The user’s ask: a separate report measuring how high the market is and how good the quality is, across three milestones: (1) breadth/width of the rally (is it broadening beyond semis? — backtrack vs history); (2) a valuation test (PE/PS/etc. vs history); (3) institutional/positioning metrics (CTA + others). Plus anything else useful.
TL;DR — expensive and stretched, but genuinely high-quality. “Priced for perfection,” not “junk bubble.”
- Valuation: historically extreme. Shiller CAPE 41.3 = the 98.9th percentile since 1881 (median 16.5; only the Dec-1999 peak of 44.2 was ever higher). Forward P/E ~21 (vs ~17–18 norm), trailing ~28, P/S ~3 (vs ~1.5), Buffett indicator ~225% of GDP (~99th pct). Every metric says expensive.
- …but adjusted for rates, thin — not apocalyptic. The Excess CAPE Yield (equity earnings yield − real 10-yr) ≈ +1.0%, below the decade median (~2.6%) and long-run (~3.5%) — the thinnest cushion over bonds in a decade — yet still positive, unlike the 2000 peak (−2.6%). Bonds at 4.6% are now real competition (§9.2a).
- Breadth: two-faced. Participation is healthy (72% of the S&P above its 200-day MA, 70% above its 60-day MA — computed from 503 constituents, Aug 4), but leadership concentration is still the narrowest in 20 years — equal-weight/cap-weight (RSP/SPY) sits at the 3rd percentile of 2005–26. The “widening” is real on a 3-month view (+1.8%) but fragile: the last week re-narrowed −3.5% on mega-cap earnings, and only 3 of 11 sectors beat the S&P over the past month.
- Forward returns: the price you pay caps what you get. Backtesting 145 years, the cheapest CAPE decile returned +11.7%/yr real over the next 10 years; the most expensive +0.6%/yr. Starting from CAPE ≥34 (like today’s 41.3), the average forward 10-yr real return was −2.4%/yr (range −5.9% to +1.7%) — see §9. Every prior CAPE ~40 (1929, 2000) preceded a −43% to −77% real drawdown.
- Positioning: stretched/asymmetric. CTAs net long (~$34B S&P) with $100B+ of mechanical downside if momentum breaks; VIX 16.5 (48th pct) — no fear cushion.
- Quality: the genuine bull anchor. Record earnings + record net margins. This is why it’s the AI-bubble report’s “1998→late-1999, loaded but unlit” market, not a profitless-1999 blow-off. High price, but real earnings underneath.
- Net: the market is HIGH (valuation ~99th pct, positioning stretched) with a THIN margin of safety — but the quality is high. Vulnerable to a positioning/rate/credit shock, not to a valuation-only collapse.
- Education/analysis, NOT investment advice.
⚠️ Protocol & data-hygiene notice
Applies the Two-Step Research Protocol. §1 method · §2 Step-1 draft · §3 Step-2 review · §4 breadth · §5 valuation · §6 positioning · §7 quality · §8 composite verdict.
Rule 4 flags: (a) yfinance columns are alphabetical → indexed by name. (b) CAPE percentile, breadth (RSP/SPY), sector participation and VIX are computed here and reproducible; (c) forward/trailing P/E, P/S and the Buffett indicator are web-sourced point-in-time estimates (ranges, not precise) and labeled as such; (d) CTA figures conflict across dated snapshots (net-long-adding vs earlier capitulation) — directionally “stretched,” exact number provisional.
Section 1 — Fact-base & method
- Computed (reproducible,
run_market_gauge.py): RSP/SPY equal-vs-cap breadth ratio + percentile + 1wk→12mo trend (yfinance, 2005–26); 11-sector participation vs SPY; VIX level + percentile; Shiller CAPE percentile (Yaleie_data.xls, 1881–present). - Web-sourced (point-in-time, flagged): forward P/E, trailing P/E, P/S, Buffett indicator, % above 200-day MA, CTA/positioning (Goldman/DB via trade press), profit-margin/earnings records.
- Percentile = how expensive/narrow vs the asset’s own history (higher = more extreme). We report level AND percentile so outliers don’t mislead.
Section 2 — Step 1: Concise Research Draft
Core conclusion: The S&P is expensive on every valuation axis (CAPE ~99th pct), with stretched mechanical positioning and still-narrow leadership — but underpinned by record real earnings. It is a high-price, high-quality, thin-margin-of-safety market: a priced-for-perfection late cycle, not a low-quality bubble. Downside is more likely from a positioning/rate/credit trigger than from valuation alone.
Supporting (claim → evidence):
- Valuation is ~99th-percentile extreme → CAPE 41.3 = 98.9th pct since 1881; Buffett ~225% GDP. Evidence: §5 — obtained.
- Leadership breadth is historically narrow despite better participation → RSP/SPY 3rd pct; 69% >200dma. Evidence: §4 — obtained.
- Earnings quality is genuinely high → record margins + record aggregate earnings. Evidence: §7 — obtained (web).
Opposing (claim → evidence):
- High valuation may be “justified” by margins/rates → record profitability supports higher multiples. Evidence: need margin-sustainability / rate path — partly unknown.
- Breadth is broadening → bullish, not late-cycle → 3mo RSP/SPY +1.8%, 69% >200dma. Evidence: obtained, but last-week reversal + 3/11 sectors argue it’s early/fragile.
Section 3 — Step 2: Strict Peer Review (draft NOT rewritten)
- Facts to verify: exact forward/trailing P/E and P/S (ranges, provider-dependent); the 200dma breadth number (sources cite 69% and 95% — definition-sensitive); the live CTA net exposure (snapshots conflict by date); whether “record margins” are peak-cyclical (mean-reversion risk).
- Logical leaps / equivocation: do not conflate participation breadth (% >200dma, healthy) with leadership concentration (RSP/SPY, narrow) — they say opposite things and the headline “breadth is fine” hides the concentration; “high margins justify high CAPE” is a regime assumption, not a law (margins mean-revert); CAPE is a long-horizon return signal, not a timing tool.
- Missing counterexamples / competing explanations: CAPE has been “expensive” for a decade and the market kept rising (it forecasts 10-yr returns, not the next year); index composition shifted toward higher-margin tech (some CAPE elevation is structural, not pure froth); a debasement regime lifts nominal everything.
- Primary sources to add: S&P/Shiller earnings series; Yardeni/FactSet forward-P/E & margin data; Goldman/DB prime-brokerage CTA notes (primary); Fed/GDP for the Buffett denominator; NYSE/Nasdaq A-D and %>200dma primary feeds.
- Speculation, not fact: “priced for perfection”; “thin margin of safety”; that the trigger will be positioning/credit rather than valuation; the “1998→late-1999” mapping (a characterization borrowed from the AI-bubble report).
Section 4 — Breadth: the two faces (is the rally broadening?)
Face A — participation is healthy (bullish): 72% of S&P 500 constituents are above their 200-day MA and 70% above their 60-day MA (computed from 503 members, Aug 4, 2026 — chart in §9.1; matches the web’s ~69%). On a 3-month view the equal-weight index is catching up (RSP/SPY +1.8%).
Face B — leadership concentration is the narrowest in 20 years (cautionary):
| RSP/SPY (equal- vs cap-weight) | Value |
|---|---|
| Level now (2005 = 1.00) | 0.845 |
| Percentile of 2005–2026 range | 3rd |
| Change last 12mo | −1.4% (mega-caps still leading) |
| Change last 1 week | −3.5% (re-narrowed on mega-cap earnings) |
| Change last 3 months | +1.8% (broadening) |
| Sectors beating SPY (last 1mo) | 3 / 11 |
| Sectors beating SPY (last 3mo) | 4 / 11 |
Read (answering the user directly): your instinct is partly right — participation is broadening (69% >200dma, 3-month equal-weight catch-up). But the cap-weight concentration is still near a 20-year extreme, and the improvement is early and fragile: the last week actually re-narrowed −3.5% (mega-cap earnings pulled the index back up while the average stock lagged), and only 3 of 11 sectors beat the index over the past month. Verdict: genuine but unconfirmed broadening on top of historically narrow leadership. A durable regime change would show RSP/SPY rising for months and >6/11 sectors leading — not there yet.
(RSP/SPY is a clean, reproducible breadth proxy: when it falls, a handful of mega-caps are carrying the index; when it rises, the average stock is participating.)
Section 5 — Valuation: expensive on every axis
| Metric | Aug-2026 | Hist. avg/median | Percentile | Verdict |
|---|---|---|---|---|
| Shiller CAPE | 41.3 | 16.5 (median) | 98.9th (computed, 1881–now; all-time max 44.2 = Dec-1999) | Very expensive |
| Forward P/E | ~21 | ~17–18 | >90th | Expensive |
| Trailing P/E | ~28 | ~19–20 | >90th | Expensive |
| Price/Sales | ~3.0 | ~1.5 | ~99th | 2× history |
| Buffett (MktCap/GDP) | ~225% | ~100% | 99–100th | Record |
Read: there is no valuation metric that says “cheap.” The single most robust anchor — CAPE at the 98.9th percentile of 145 years, essentially matching the dot-com peak — says forward 10-year real returns are likely low. Caveat (Rule 4 / §3): CAPE is a long-horizon signal, not a timing tool (it’s been elevated for a decade); part of the elevation is structural (index tilted to high-margin tech) and regime (debasement lifts nominal valuations). But on margin of safety, the answer is unambiguous: there is very little.
Section 6 — Positioning & volatility: stretched and asymmetric
- CTAs / systematic trend-followers: net long (~$34B S&P futures, ~$93B global equity). The risk is asymmetric and mechanical: if momentum breaks, models could dump $100B+ globally regardless of fundamentals — a positioning-driven air-pocket (the same “mechanical, momentum not value” flow that can overshoot in either direction). (Rule 4: dated snapshots conflict — spring showed capitulation/short, summer net-long-adding; treat the direction “stretched,” the exact number provisional.)
- VIX 16.5 — 48th percentile (1y avg 18.2, 2005–26 median 16.8): middling, no fear cushion. Cheap-ish protection, complacent-ish tape — consistent with the tail_hedge point that hedges are best bought before stress, when VIX is low.
- Net: positioning is a fragility amplifier, not a trigger — it makes any exogenous shock (rate/credit/geopolitical) hit harder and faster.
Section 7 — Quality: the genuine bull anchor
- Record aggregate earnings + record net profit margins. This is the decisive difference from a low-quality bubble: the high price sits on real, growing profits, not story stocks.
- It is the same signal as the AI-bubble report (Micron 80% margins, hyperscaler cash machines) — the “1998→late-1999, shovels genuinely profitable” market. Expensive because the earnings are real and accelerating, not detached from them.
- The quality caveat (§3): record margins are a cyclical high and can mean-revert; and quality is concentrated in the same mega-caps that dominate the index (see §4). So “high quality” and “narrow” are two sides of one coin — the quality is real but not broadly distributed.
Section 8 — Composite verdict: how high, how good
Percentile scorecard:
| Axis | Reading | Signal |
|---|---|---|
| Valuation — CAPE | 41.3 (98.9th pct) | 🔴 EXPENSIVE |
| Valuation — Buffett | ~225% GDP (~99th) | 🔴 EXPENSIVE |
| Breadth — concentration | RSP/SPY 3rd pct | 🟠 NARROW |
| Breadth — recent trend | 3mo +1.8% / 1wk −3.5% | 🟡 broadening but fragile |
| Positioning — VIX | 48th pct | 🟡 mid / no cushion |
| Positioning — CTA | net long, $100B+ downside | 🟠 stretched/asymmetric |
| Quality — earnings | record earnings + margins | 🟢 HIGH (real profits) |
How HIGH:     Very. Valuation ~99th percentile (CAPE ~ dot-com peak), Buffett a
              record, positioning stretched. Margin of safety is THIN.
How GOOD:     Genuinely good. Record earnings + margins; participation improving.
              This is quality-led, not junk-led.
The synthesis: "PRICED FOR PERFECTION." A high-price, high-quality, thin-cushion,
              still-narrow late-cycle market. Not a profitless 1999/2000 blow-off,
              but little room for error.
Maps to:      The AI-bubble report's "1998 -> late-1999, loaded but unlit"
              (ai_bubble Addendum C): fragility preconditions present, trigger absent.
Vulnerability: A POSITIONING / RATE / CREDIT shock (CTA unwind, a Fed surprise,
              the Oracle/AI-credit canary), NOT a valuation-only collapse.
What would improve quality: RSP/SPY rising for months + >6/11 sectors leading
              (durable breadth) — would make the highs healthier and less fragile.
Bottom line for the user: the market is historically high — CAPE at the 99th percentile (basically the 1999 level), Buffett at a record, positioning stretched, leadership still the narrowest in 20 years. But the quality is genuinely good: record earnings and margins mean this is a priced-for-perfection, high-quality tape, not a profitless bubble. Your read that “width is getting better” is partly right — participation is improving (69% >200dma) — but the cap-weight concentration is still near a two-decade extreme and last week actually re-narrowed, so treat the broadening as real but unconfirmed. Practically: thin margin of safety + high quality = stay invested but hedged/diversified (this is exactly the 30/30/40 barbell and tail-hedge case), and watch the positioning/credit triggers, not the P/E, for the turn.
Section 9 — Deep-Dive Update (Aug 4, 2026): true breadth, charts, forward returns & valuation peaks
Added per the user’s follow-up: (a) true breadth from the 503 constituents (% above 60-day and 200-day MA), (b) a CAPE → forward-return backtest, charts to see the trends, and a peak/bottom history (“a high P/E like 26 — which year, why, and what happened after?”). All reproducible via
run_deep_dive.py.
9.0 Two-Step Protocol (for the new claims)
Step 1 — Concise draft. Core conclusion: today’s valuation (CAPE ~99th pct) sits in the zone that, across 145 years, preceded near-zero-to-negative 10-yr real returns, while breadth confirms healthy-but-narrow participation — reinforcing the §8 “priced-for-perfection” verdict.
- Support 1: cheap-start → high forward return, expensive-start → low → CAPE decile table (§9.2). Evidence: obtained.
- Support 2: every prior CAPE ~40 ended badly → 1929/2000 drawdowns −77%/−43% (§9.3). Evidence: obtained.
- Support 3: participation is genuinely broad now → 72% >200dma / 70% >60dma computed (§9.1). Evidence: obtained.
- Counter 1: high margins/structure may justify higher CAPE → margins record; index tech-tilted. Evidence: partial — margin mean-reversion unknown.
- Counter 2: CAPE is not a timing tool → it’s been >30 since ~2017 and the market rose. Evidence: obtained (1-yr column is weak).
Step 2 — Peer review. (1) Verify: the 41.3 print (web) vs my Shiller file that ends Sept-2023 — the percentile/backtest use history through the file, and 41.3 is applied as a marker; the constituent breadth uses current membership (survivorship bias — dropped names excluded). (2) Equivocation: “forward 10-yr real −2.4%” is an average of overlapping start-months (autocorrelated; small effective n≈36) — directionally strong, statistically soft. (3) Missing counter: the CAPE ≥34 sample is dominated by 1998–2000 and 2021 — a narrow set of regimes, not 145 independent draws. (4) Primary sources: Shiller original series; Bunn/Shiller CAPE-return studies; a survivorship-free constituent history. (5) Speculation, not fact: that today “must” deliver −2.4% (it’s a base rate, not a forecast); the peak analogies (each cycle differs).
9.1 True breadth from constituents (computed today)
As of Aug 4, 2026: 72% of the 503 members are above their 200-day MA, 70% above their 60-day MA. This confirms (and slightly upgrades) the web’s ~69% and settles §4’s “Face A” — participation is genuinely broad, and the 60-day (faster) line sitting just below the 200-day says the very-recent momentum is neither overheated nor breaking.
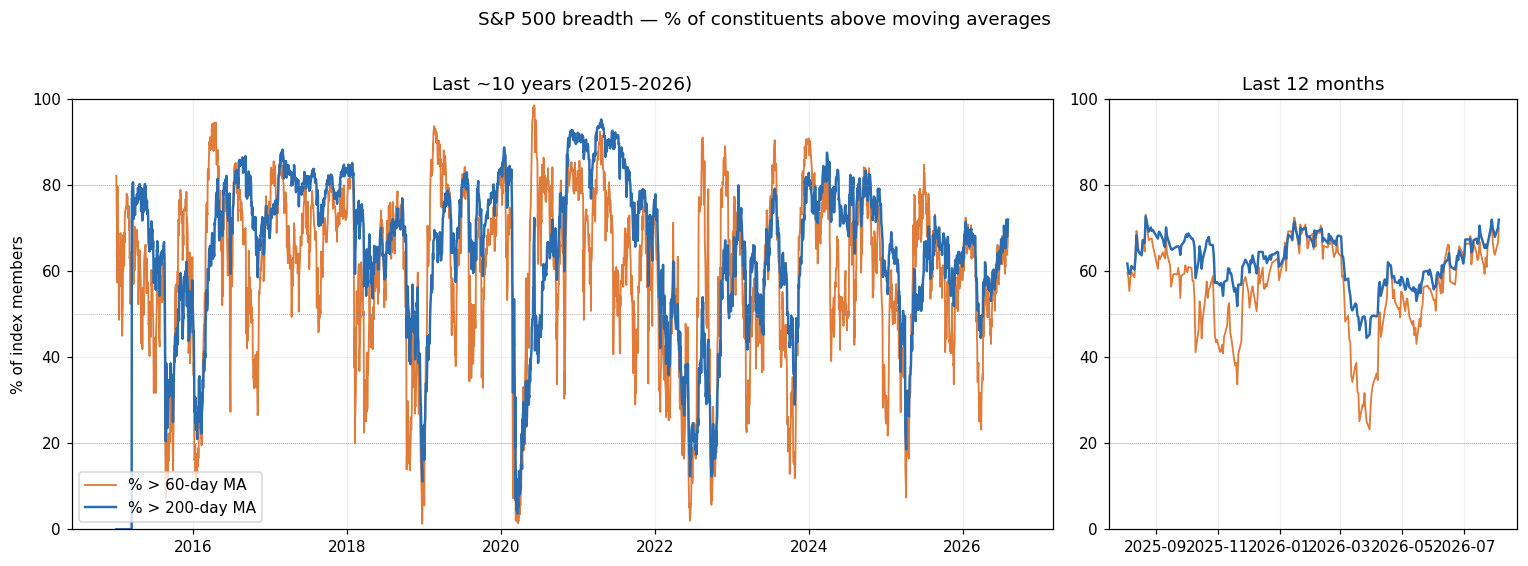
Left: the last ~10 years (2015–2026); right: the last 12 months. Read: healthy participation (both lines ~70%), recovered from the early-2026 dip. Across the decade, breadth swings 20–90% — today’s ~70% is middling-to-healthy, not euphoric. But recall §4 Face B — this broad participation coexists with record cap-weight concentration (RSP/SPY 3rd percentile). Two true things at once.
9.2 Valuation through time + the forward-return backtest
Is forward P/E ~21 really above the historical average? Yes — forward P/E ~21 vs a ~10-yr average of ~17–18 is ~15–20% above trend; the longer-history median P/E is ~15–16, so it’s richer still. But the cleanest long-history anchor is CAPE:
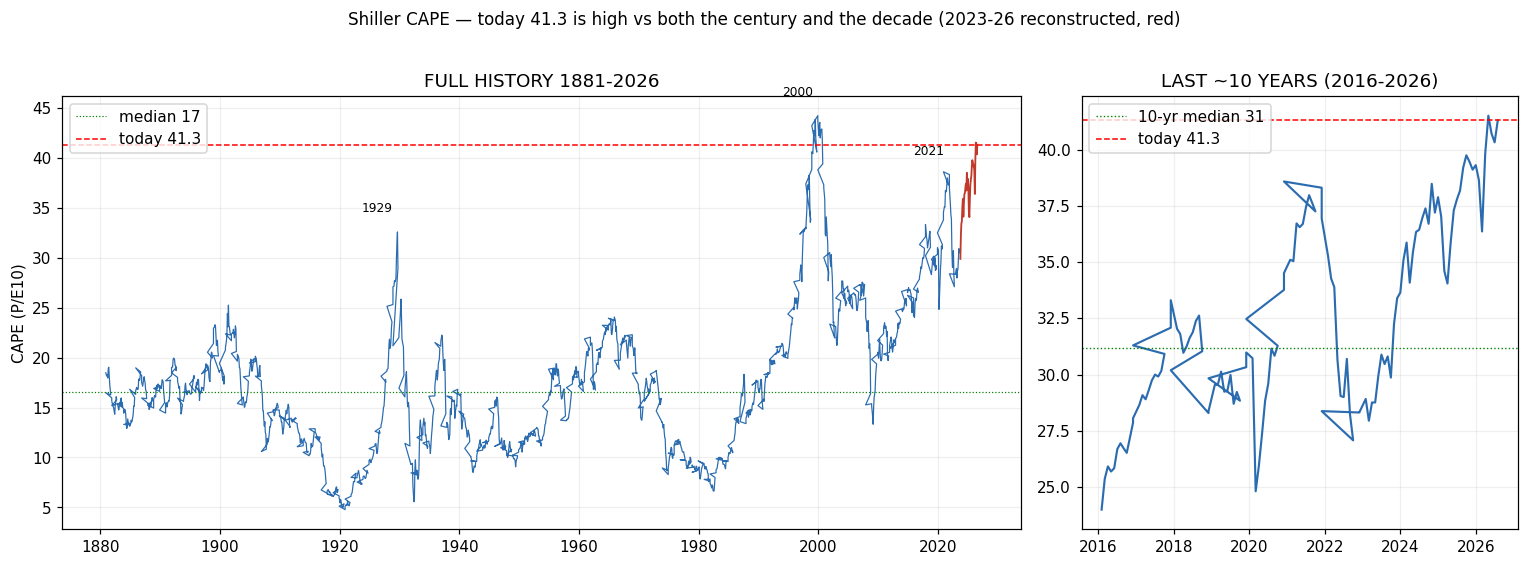
Left: full history 1881–2026; right: the last ~10 years (2016–2026). Today’s CAPE 41.3 (red) is above the 1929 peak (32.6) and the 2021 peak (38.6), and second only to the 2000 peak (44.2), versus a 145-yr median of ~17. And it’s high even against the recent decade: the 2016–2026 median CAPE is ~31 — today’s 41.3 tops the decade too. (Data-hygiene note, Rule 4: Yale’s Shiller mirror ends Sep-2023 at CAPE 30.8; the 2023–2026 tail (red) is reconstructed from real price with the slow 10-yr-earnings denominator calibrated to the reported 41.3 — a transparent two-anchor interpolation, not a new data source.)
The backtest — starting valuation vs subsequent real total return (annualized, 1881→now):
| CAPE decile | CAPE range | Fwd 1-yr | Fwd 3-yr | Fwd 10-yr |
|---|---|---|---|---|
| 1 (cheapest) | 4.8–9.3 | +16.7% | +12.8% | +11.7% |
| 5 (median) | 15.0–16.5 | +7.2% | +5.0% | +6.7% |
| 9 | 22.4–26.9 | +6.2% | +5.7% | +4.5% |
| 10 (most expensive) | 26.9–44.2 | +2.9% | +0.9% | +0.6% |
| Start at CAPE ≥34 (like today) | ≥34 | — | — | −2.4%/yr avg (−5.9% to +1.7%) |
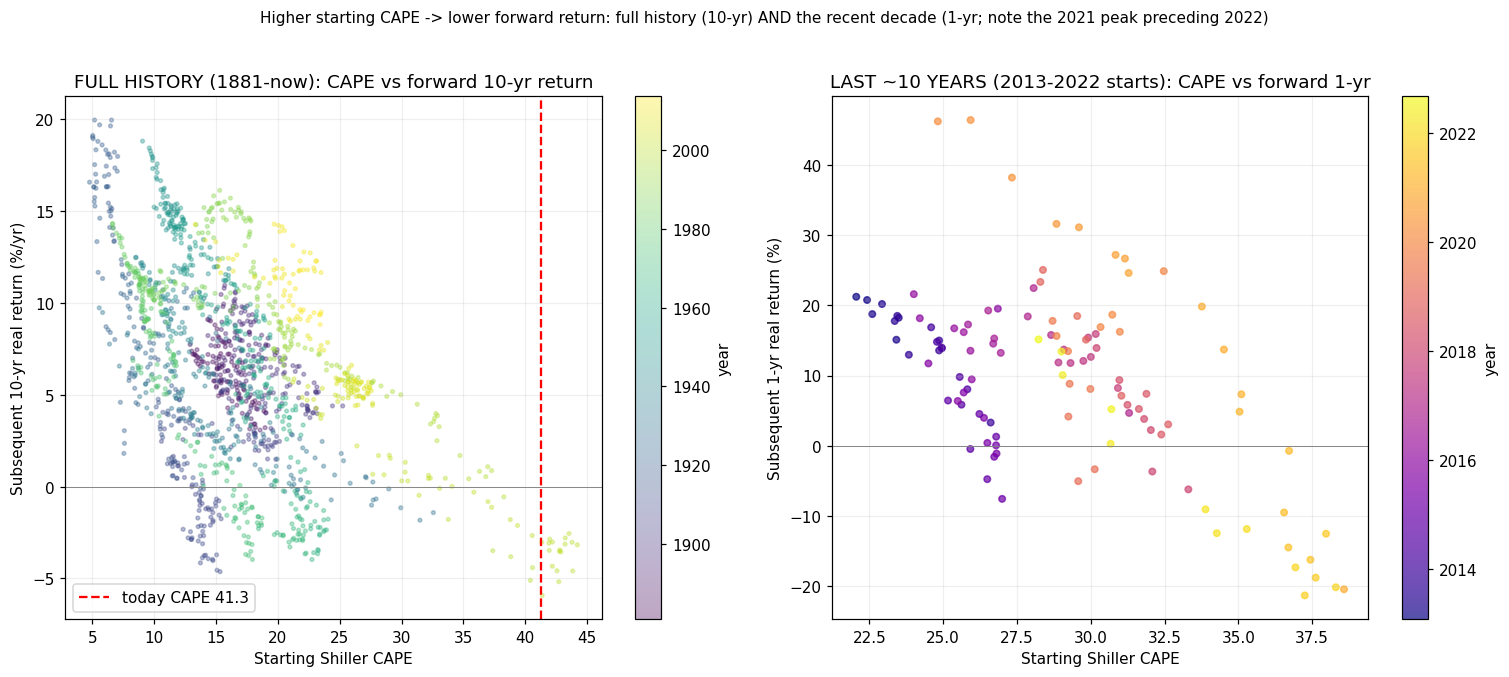
Left: full history (1881–now), CAPE vs forward 10-yr real return; right: the last ~10 years (2013–2022 starts), CAPE vs forward 1-yr real return.
Read: the relationship is monotonic and strong — the price you pay caps the return you get. The top decile has historically delivered ~0%/yr real over a decade; the ≥34 zone (where we are) has averaged negative. Strikingly, the recent-decade panel slopes down too: even at a 1-year horizon, the decade’s highest CAPE readings (the 2021 peak, ~38) were followed by −10% to −20% real (the 2022 bear), while the cheaper 2013–2016 starts (CAPE ~24) delivered positive years. Caveat (§9.0): the recent-decade 1-yr signal leans heavily on the single 2022 episode — suggestive, not proof; and none of this dates the exact top (the 1-yr signal is noisy in the full sample).
9.2a Adjusting for rates — the equity risk premium (the “vs bonds” view)
The one thing raw CAPE misses: “expensive vs history” implicitly assumes bonds yield what they used to. They don’t — the 10-yr Treasury is ~4.6% now vs ~2% through the 2010s. The rate-aware gauge is the Excess CAPE Yield (ECY) = CAPE real earnings yield (1/CAPE) − real 10-yr yield — i.e., the premium stocks offer over bonds.
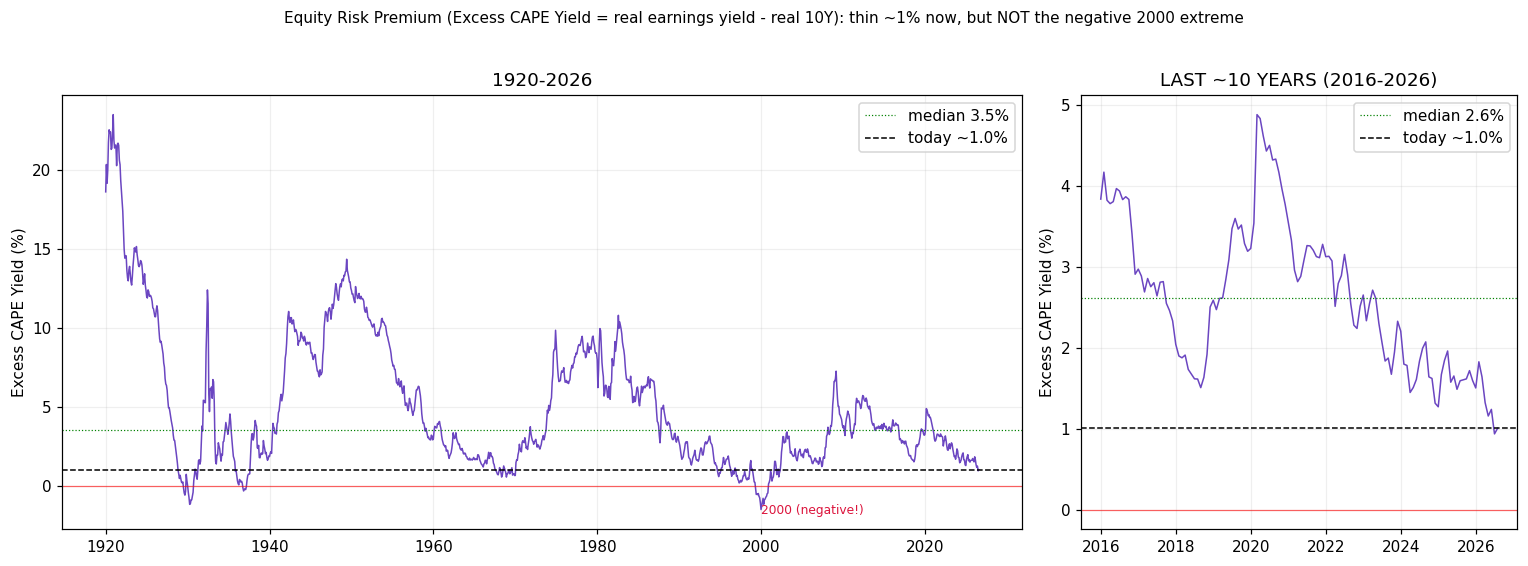
As of Aug 2026, ECY ≈ +1.0% — below the last-decade median (~2.6%) and the long-run median (~3.5%): the thinnest equity cushion over bonds in the entire decade (it was ~4% in the mid-2010s and ~4.9% at the 2020 low). But — the crucial nuance — it is still positive, unlike the 2000 peak (−2.6%). Because 2000 paired a high CAPE with high real rates, whereas today’s real rates are lower, the rate-adjusted picture is expensive but not the no-premium extreme of the dot-com top.
Two-sided read:
- 🔴 Bearish: the premium over bonds has compressed from ~4% (mid-2010s) to ~1% — bonds are now genuine competition; this is the higher-for-longer regime taxing equities, and it’s why “just own stocks” is a weaker reflex than in the 2010s.
- 🟢 Tempering: on a rates basis we’re at roughly the 10–25th percentile — thin, but positive; part of the raw-CAPE alarm is offset once you stop comparing today’s multiple to a near-zero-rate decade. This is the strongest single argument against a pure “CAPE = 2000 redux” panic — and it’s exactly why the 30/30/40 barbell’s gold + a Treasury sliver matters more now (bonds finally pay).
(Data hygiene, Rule 4: ECY history is Shiller’s own column through Sep-2023; the 2023–26 extension is anchored to that last value and moved by the change in CAPE-yield and the nominal 10-yr — a constant inflation expectation cancels in the rate difference. Level is approximate; the trend/percentile is robust.)
9.3 Valuation peaks & troughs — which year, why, what happened after
(Real total-return drawdown and forward-10-yr real CAGR computed from Shiller’s real-TR index.)
| Event | ~CAPE | Driver | Next 5-yr real drawdown | Next 10-yr real CAGR |
|---|---|---|---|---|
| 1929-09 peak | 32.6 | Roaring-20s leverage/margin mania | −77% | −1.4%/yr |
| 1966 peak | 24.1 | Nifty-Fifty start; pre-stagflation | −22% | −2.5%/yr |
| 2000-03 peak | 44.2 | Dot-com internet bubble | −43% | −2.8%/yr |
| 2007-10 peak | 27.5 | Housing/credit peak | −50% | +5.7%/yr |
| 2021-12 peak | 38.6 | Post-COVID stimulus / mega-cap | −24% (partial) | −5.8%/yr (ongoing) |
| 1982-07 trough | 6.6 | Volcker recession; 14% inflation broke | 0% | +14.3%/yr |
| 2009-03 trough | 13.3 | GFC bottom | 0% | +14.3%/yr |
On the user’s specific example — “a high P/E like 26”: a trailing P/E in the mid-to-high 20s (CAPE mid-20s to ~30) has clustered at 1929, 1966, 2007 — each a major top that preceded −22% to −77% real drawdowns and a lost decade of real returns. The mirror image is decisive: the two cheapest starts (1982 CAPE 6.6, 2009 CAPE 13.3) delivered +14%/yr real for the next decade. Valuation didn’t time the exact top, but it powerfully set the 10-year payoff — and today’s 41.3 is on the wrong end of that.
9.4 What this adds to the verdict
- The §8 “priced for perfection” call is reinforced with a number: from here, the base-rate 10-yr real return is ~0 to negative, and every historical CAPE ~40 preceded a deep real drawdown.
- But quality (§7) and broad participation (§9.1) are why it’s “1998→late-1999,” not March-2000 — real earnings, 72% of stocks participating. High price on high quality.
- Practical implication is unchanged and sharper: a low expected return + thin margin of safety argues for the 30/30/40 barbell (gold’s uncorrelated real return matters more when equity forward returns are low) and for watching positioning/credit for the turn — valuation sets the stakes, not the timing.
Reproduce it yourself
cd market_gauge
python run_market_gauge.py     # writes data/*.csv (breadth, sector breadth, valuation, VIX, scorecard)
python run_deep_dive.py        # §9: constituent breadth (60/200dma), CAPE forward returns, ERP, peaks -> charts/*.png
Data files (market_gauge/data/): breadth.csv, sector_breadth.csv, valuation.csv, vix.csv, scorecard.csv, plus §9: breadth_constituents.csv, cape_forward_returns.csv, excess_cape_yield.csv, valuation_peaks.csv. Charts (market_gauge/charts/): breadth_constituents.png, cape_history.png, cape_forward_scatter.png, erp_excess_cape_yield.png. CAPE computed from Yale ie_data.xls; constituents from the datasets/s-and-p-500-companies list; 10-yr yield from yfinance ^TNX.
Sources (accessed Aug 4, 2026): yfinance (RSP, SPY, ^VIX, 11 SPDR sectors); Yale/Shiller ie_data.xls (CAPE 1881–now); web valuation (MacroMicro, investsnips, GuruFocus, worldperatio — forward/trailing P/E, CAPE, Buffett); breadth (Stock Alarm Pro, MacroMicro, CondorEdge — %>200dma, A/D); positioning (Goldman/Deutsche Bank via Yahoo/Hedgeweek/Investing.com — CTA/sentiment). PE/PS/Buffett are point-in-time estimates (Rule 4); CTA snapshots conflict by date.
Two-Step Research Protocol applied (§2 draft + §3 review). Computed metrics reproducible; web-sourced levels flagged. CAPE is a long-horizon, not a timing, signal. Education/analysis only — not investment advice.