VLCC Supply Deep-Dive: Does the 2027/2028 Newbuild Wave Break the Cycle?
Turning scary GROSS deliveries into NET fleet growth
August 22, 2026 — Cyclical Supply Analysis (CRule 3)
The user’s question: ~68 new VLCCs arrive in 2027 and ~125 in 2028 (plus Suezmax etc.). Will these numbers greatly influence the supply-demand balance?
TL;DR — The gross numbers look alarming; the NET picture is what matters, and it splits by year.
- The wave is real and 2028 is the pivot. 68 (2027) + 125 (2028) ≈ 193 gross deliveries = ~21% of the ~900-ship fleet over two years. On a gross basis 2028 alone is +13% — the biggest supply shock since 2008–10.
- But gross ≠ net. The offset is a record aging pool. ~130 VLCCs are already >20 years old (~20% of the fleet), doubling to ~300 by 2029–30. IMO-2030 / EEXI / CII make these un-charterable — a forced-scrapping reservoir arriving at exactly the same time. NET 2027–28 fleet growth is +7.6% (high-scrap) to +16.4% (low-scrap), not the +21% gross headline.
- 2027 stays tight; 2028 is where it bites. Net 2027 growth is only +2.5% to +5.8% (deliveries modest, restocking still soaking up ships). 2028 net +4.9% to +9.9% is the real test — and it lands after the current tight window this repo has flagged (see report #13, sweet spot “now through mid-2028”).
- Demand is the swing, and it’s softening. Tonne-mile growth is ~0% for 2027–28 (BIMCO), so unlike 2021–24 there’s little demand tailwind to absorb the ships — except the SPR restocking (~30–70 VLCCs for years) and the shadow-fleet exit (~166 ships leaving compliant trade), which together cushion 2027 but may not fully offset the 2028 delivery cluster.
- Verdict: YES, materially — but as a 2028 rate-normaliser, not a 2027 cycle-killer. The supply wave caps the upside and sets the cycle’s expiry around late-2027/2028, consistent with the repo’s exit discipline (CRule 8). The decisive unknown is scrapping pace — the single variable that separates “healthy renewal” from “oversupply.”
- Education/analysis, NOT investment advice.
⚠️ Protocol & data notice
Applies the Two-Step Research Protocol and Cyclical CRule 3 (supply-demand duration). §1 fact-base/Rule-4 ranges · §2 Step-1 draft · §3 Step-2 review · §4 the NET-growth model · §5 demand side · §6 verdict & triggers. Builds on repo #13 Supply Shortage and #37 Cycle Position Jun-2026. Model reproducible via run_supply_model.py.
Section 1 — Fact-base (verified Aug 22, 2026; Rule-4 ranges flagged)
| Metric | Figure | Source / note (Rule 4) |
|---|---|---|
| Total VLCC fleet | ~900 (870–917) | Clarksons WFR / Fairway / Affinity, Jan-2026 |
| Compliant “mainstream” fleet | ~650–700 | Repo #13 (shadow ~166–200 excluded) |
| 2027 gross deliveries | ~41–68 | User cited 68; Gibson ~41 — a >20% spread, flagged. Model uses 68 (conservative-bearish) |
| 2028 gross deliveries | ~125–127 | Seatrade/MSI “127 scheduled for 2028”; user’s 125 ✓ |
| H1-2026 VLCCs ordered | ~177 (record) | MSI; orderbook jumped to ~35% of fleet (was 2% in 2023) |
| VLCCs >20 yrs old | ~130 (~20%) → ~300 by 2029–30 | Splash247 / Tankers International |
| Recent scrapping | ~1 (2024), ~5 (2025) | Near-zero — high rates deferred it |
| Tonne-mile demand growth | ~+2% (2026) → ~0% (2027) → flat (2028) | BIMCO |
| SPR restocking demand | ~30–70 VLCCs, multi-year | Repo #13 (IEA 400Mbbl release + China/India) |
| Shadow fleet (exiting compliant trade) | ~166–200 VLCCs | Repo #13 — “one-way door” |
Rule-4 discrepancy to keep front-of-mind: 2027 deliveries are cited anywhere from 41 (Gibson) to 68 (user) — a >20% gap that materially changes 2027 tightness. I model the higher (68) figure so the conclusion is stress-tested against the more bearish supply case; if Gibson’s 41 is right, 2027 is even tighter than shown.
Section 2 — Step 1: Concise Research Draft
Core conclusion: The 2027/2028 orderbook will materially loosen the market — but chiefly in 2028, and chiefly as a cap on upside / rate-normaliser, not a 2027 collapse — because record gross deliveries are offset by a record aging/scrap pool and by SPR + shadow-fleet dynamics. Net fleet growth, not gross, is the right lens.
Supporting (claim → evidence needed):
- Net ≪ gross because a record scrap pool arrives simultaneously → 130→300 ships cross 20yo; IMO-2030 forces exit. Evidence: §1 age data + §4 model — obtained.
- 2027 stays tight → modest net growth (+2.5–5.8%) + ongoing SPR restocking. Evidence: §4/§5 — obtained.
- 2028 is the genuine loosening → +13% gross / +5–10% net, into ~0% tonne-mile demand. Evidence: §4/§5 — obtained.
Opposing (claim → evidence needed):
- Scrapping may NOT accelerate → net stays near gross → real oversupply → owners defer scrapping while rates are high (as in 2024–25). Evidence: forward scrap rates — unknown/behavioural.
- Suezmax/LR2 cascade adds effective VLCC supply → a heavy Suezmax orderbook can substitute on some routes. Evidence: Suezmax orderbook + substitution elasticity — only partially obtained.
Section 3 — Step 2: Strict Peer Review (draft NOT rewritten)
- Facts that need verification: the exact 2027 delivery count (41 vs 68 — provider-dependent, changes 2027 by ~4% of fleet); real 2027–28 scrapping (behavioural, not yet observed); whether “300 ships >20yo by 2030” actually scraps or just migrates to the shadow fleet (which would mean neither compliant supply relief nor removal); precise Suezmax orderbook and its VLCC-substitution rate.
- Logical leaps / equivocation: “aging pool = scrapping” is the central equivocation — an old ship can scrap OR join the shadow fleet; only the former reduces total supply. Also “deliveries = supply growth” ignores yard slippage (2028 orders routinely slip to 2029). And gross-orderbook-% of the total 900 fleet vs the compliant 700 fleet give very different growth rates — must be explicit about the denominator.
- Missing counterexamples / competing explanations: a demand shock (SPR restocking finishing early, a China slowdown, OPEC+ cuts) would make even net 2028 growth painful; conversely a shadow-fleet re-absorption (sanctions lifted) is a supply shock the model doesn’t include. The 2008–10 analog (heavy deliveries into a demand collapse → multi-year bear) is the cautionary reference (CRule 6).
- Most important primary sources to add: Clarksons World Fleet Register delivery schedule (ship-by-ship ETAs); Clarksons/Gibson age profile and demolition forecasts; BIMCO/Drewry tonne-mile models; company (DHT/FRO/CMES) fleet-renewal disclosures.
- Sentences that are at most speculation, not fact: “2028 is the pivot / rate-normaliser”; the specific net-growth percentages (they depend entirely on assumed scrap rates); “restocking cushions 2027”; and the timing of the cycle’s expiry — all are scenario projections, not established facts.
Section 4 — The NET-growth model (the heart of the answer)
Gross deliveries are offset by scrapping. Three scrap-behaviour scenarios; fleet start 2026 = 900. Reproducible in run_supply_model.py.
Net fleet growth (% of fleet/yr):
| Year | Gross deliv. | Gross % | NET % — Low scrap | NET % — Base | NET % — High scrap |
|---|---|---|---|---|---|
| 2026 | 15 | +1.7% | +1.1% | +0.8% | +0.3% |
| 2027 | 68 | +7.5% | +5.8% | +4.2% | +2.5% |
| 2028 | 125 | +13.0% | +9.9% | +7.4% | +4.9% |
| 2029 | 90 | +8.5% | +4.3% | +2.0% | −0.5% |
| 2030 | 40 | +3.6% | −0.5% | −1.9% | −4.1% |
Cumulative 2027+2028 NET additions:
| Scenario | Gross | Scrapped | NET add | % of fleet (2 yrs) |
|---|---|---|---|---|
| Low scrap (rates high, defer) | 193 | 45 | +148 | +16.4% |
| Base (IMO-2030 gradual exit) | 193 | 85 | +108 | +12.0% |
| High scrap (regulatory cliff) | 193 | 125 | +68 | +7.6% |
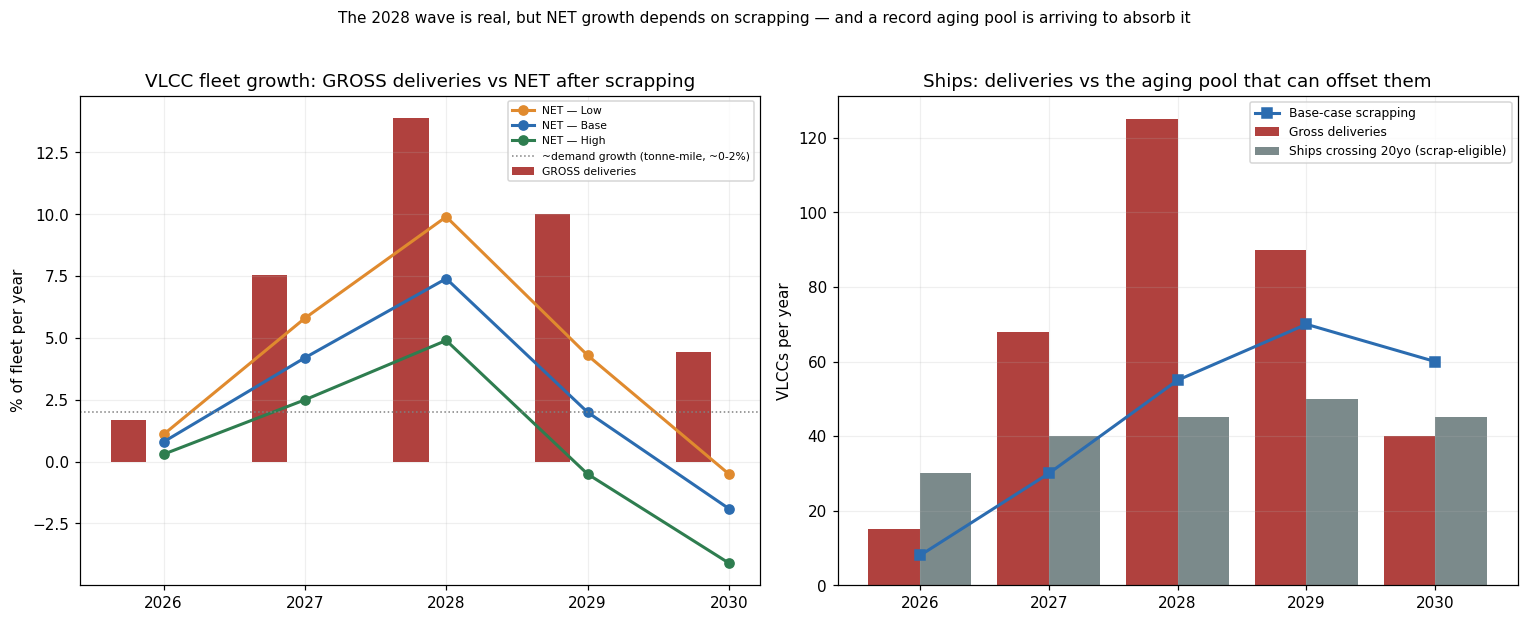
Read: the gross bars (red) are frightening — +13% in 2028. But the net lines collapse toward (Base) or below (High) the ~0–2% demand-growth dotted line by 2029–30, because the right-hand panel’s grey aging pool (ships crossing 20yo) is large enough to absorb much of the wave if it scraps. The entire question reduces to one variable: does scrapping accelerate? In High-scrap, 2029–30 actually shrinks the fleet; in Low-scrap, the market is oversupplied for years.
Section 5 — The demand side (why 2027 ≠ 2028)
Supply never acts alone. Two demand cushions explain why 2027 stays tight while 2028 loosens:
- SPR restocking (the near-term shock absorber). Per repo #13, the IEA 400-Mbbl release + China/India rebuild absorb ~30–70 VLCCs continuously for 3–5 years. That is 4–10% of the effective fleet removed from the trading pool — enough to soak up the modest 2027 net additions. By 2028, if restocking matures, this cushion thins just as deliveries peak.
- Shadow-fleet exit (the structural tightener). ~166–200 shadow VLCCs are leaving compliant trade permanently. Newbuilds therefore partly replace disappearing tonnage rather than pure addition — the compliant fleet grows far less than the total fleet. Caveat (§3): if aging ships join the shadow fleet instead of scrapping, the compliant market tightens but total global supply doesn’t fall.
- Tonne-mile is flat (the headwind). Unlike 2021–24, BIMCO sees ~0% tonne-mile growth in 2027–28 — so there’s no organic demand growth to absorb ships. This is why the 2028 cluster matters: it hits a market with no demand tailwind, leaning entirely on scrapping + restocking to stay balanced.
Net demand-supply read: 2027 ≈ balanced-to-tight (modest net supply + restocking); 2028 = the first genuine loosening (peak deliveries, thinning restocking, flat demand) unless High-scrap materialises.
Section 6 — Verdict, cycle timing & triggers
Answering directly — will 68 (2027) + 125 (2028) greatly influence the balance?
- 2027: No, not greatly. Net +2.5–5.8%, largely absorbed by SPR restocking + shadow exit. The tight window holds.
- 2028: Yes, materially — this is the pivot. +13% gross / +5–10% net into ~0% demand growth is the first real loosening; it caps upside and starts normalising rates, matching this repo’s “sweet spot now through mid-2028” and rate path ($100–150k in 2027 → $70–100k H2-2028+, #13).
- It’s a rate-normaliser, not necessarily a cycle-killer — because the record aging pool + IMO-2030 can offset much of the wave if scrapping accelerates. Even Base-case leaves rates historically strong; only Low-scrap risks genuine oversupply.
Cycle-position summary (CRule 1/3 format):
Current position: Late-mid cycle; supply response now VISIBLE in the orderbook (35% of fleet).
Evidence:         Gross deliveries 2027=68, 2028=125 (~21% of fleet); orderbook 2%->35% since 2023.
Historical analog: 2008-10 (heavy deliveries into softening demand) — but MITIGATED by the
                  shadow-fleet exit + record scrap pool that did NOT exist in 2008.
Predicted path:   2027 tight -> 2028 first loosening -> 2029-30 balance hinges on scrapping.
Time to peak (rates): late-2027/2028 is the supply-driven expiry of the strong window.
Key risk:         Scrapping does NOT accelerate (Low-scrap) -> net stays ~gross -> oversupply.
Triggers to watch (CRule 8 exit discipline):
- Scrapping run-rate — the master variable. Monthly demolition sales < ~3–4/mo through 2027 = Low-scrap oversupply risk building.
- 2028 delivery slippage — yard delays pushing ships to 2029 extend the window (bullish); on-time delivery is bearish.
- Shadow-fleet re-absorption — any sanctions thaw returns tonnage = a second supply shock (the seasonality report §8 “black-to-white” risk).
- SPR restocking completion — when IEA/China/India stop buying, the near-term cushion vanishes.
- New orders — the orderbook is already ~35%; further heavy ordering pushes the oversupply risk into 2029–30 (CRule 5 sell-signal: “order books filling”).
Bottom line for the user: the raw numbers (68 + 125) look like a cycle-breaker, but on a net basis they’re a 2028 rate-normaliser, not a 2027 collapse — the same record ordering that scares you is arriving alongside a record aging fleet and a permanent shadow-fleet exit that absorb much of it. The market stays tight through ~mid-2028, then loosens; how much it loosens depends almost entirely on scrapping pace. Practically: this confirms the cycle’s expiry window (late-2027/2028) and argues for the repo’s exit discipline — ride the tight 2026–H1-2028, then trim into the 2028 delivery cluster rather than holding for a 2008-style overhang.
Reproduce it yourself
cd vlcc_supply
python run_supply_model.py     # writes data/balance.csv + charts/net_growth.png
Assumptions are explicit and editable at the top of run_supply_model.py (gross deliveries, scrap scenarios, aging pool). Data files: vlcc_supply/data/balance.csv. Chart: vlcc_supply/charts/net_growth.png.
Sources (accessed Aug 22, 2026): Clarksons World Fleet Register / Newbuilding index; MSI & Shipping Telegraph (H1-2026 orders, 2028 deliveries); Gibson (2027 deliveries); Splash247 / Tankers International (age profile); Seatrade-Maritime (2028 squeeze); BIMCO (tonne-mile); this repo #13 (compliant fleet, shadow fleet, SPR restocking). 2027 delivery count (41 vs 68) and forward scrapping are the key Rule-4 uncertainties.
Two-Step Research Protocol applied (§2 draft + §3 review). Model assumptions are scenarios, not forecasts; net-growth figures depend entirely on the scrap-rate inputs. Education/analysis only — not investment advice.